Instant Access
Massive Library
100% secure checkout
Support 24/7
Josh Aharonoff – CFO Excel Dashboard & Reporting
$997.00 Original price was: $997.00.$99.00Current price is: $99.00.
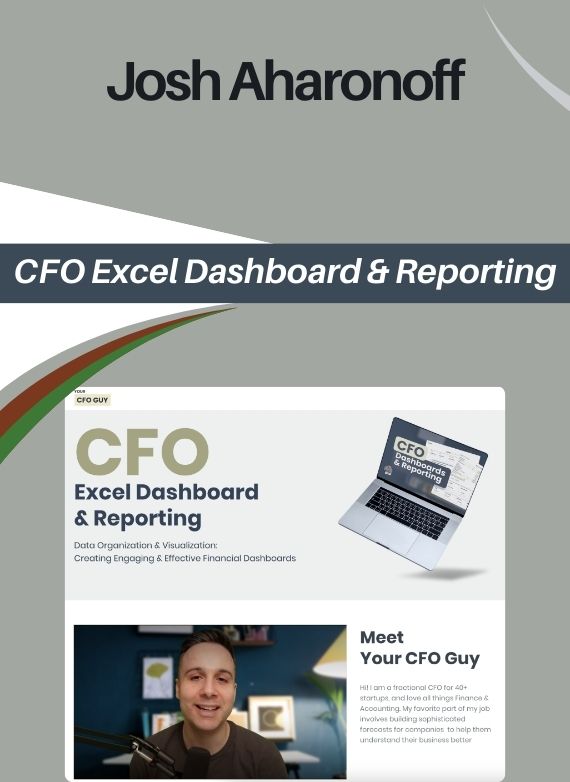
Josh Aharonoff – CFO Excel Dashboard & Reporting
Master Excel Reporting and Dashboards for Financial Success
If you’re looking to elevate your financial reporting and dashboard skills, Josh Aharonoff’s *CFO Excel Dashboard & Reporting* course is the perfect solution. This in-depth course covers all the essential techniques for organizing, analyzing, and presenting your data in a professional, dynamic way. Whether you’re creating financial reports, designing KPI dashboards, or mastering PowerQuery for data transformation, this course has you covered.
With detailed video lessons and a structured curriculum, you’ll learn how to organize your financial data effectively, build custom reports, and design stunning dashboards that will impress your clients and stakeholders. The skills you gain will help you become an expert in Excel financial reporting, empowering you to provide insights that drive decision-making and business success.
Overview of the CFO Excel Dashboard & Reporting Course
The *CFO Excel Dashboard & Reporting* course is designed to give you all the tools you need to create comprehensive financial reports and dynamic dashboards using Excel. Josh Aharonoff walks you through every step of the process, from setting up your data and building tables to creating advanced dashboards that track key financial metrics and help with decision-making.
This course is broken down into easy-to-follow modules, so whether you’re a beginner or an experienced Excel user, you’ll quickly learn how to use PowerQuery, PivotTables, and other powerful Excel features. The course also includes valuable techniques for designing impactful dashboards that provide a clear visual representation of financial data and performance.
What You’ll Learn
In this course, you’ll master the following key Excel skills:
- Organizing and transforming data using PowerQuery.
- Creating detailed financial reports, including Profit & Loss, Balance Sheet, and Cash Flows.
- Building KPI dashboards with dynamic elements like graphs and charts.
- Using PivotTables and PivotCharts to summarize financial data and create interactive reports.
- Designing visually impactful management and budget vs. actual dashboards.
- Building a break-even analysis and other performance dashboards to track business metrics.
Course Contents
MODULE 1: Intro & Getting Started
Course Intro
Introduction to the course, where you’ll learn the structure, tools, and the skills you’ll gain throughout the program.
Your Tech Stack
Learn the essential tools and technologies you’ll use in this course, setting the foundation for your work in Excel.
MODULE 2: Organizing Your Data
Creating Tables + Adding Additional Context
Learn how to structure and organize your data with Excel tables, adding context and clarity for better understanding.
Using PowerQuery to Transform Your Data
Discover the power of PowerQuery and how it can simplify data transformation and clean-up tasks in Excel.
MODULE 3: Creating Summarized Financials Report
Setting Dates & Profit & Loss
Learn how to set up dates for financial reporting and build your first Profit & Loss statement in Excel.
Balance Sheet & Cash Flows
Understand how to create and manage balance sheets and cash flows, key components in any financial report.
MODULE 4: Creating Dashboards
Getting Data Ready for Dashboards
Learn how to prepare your data for building powerful and insightful dashboards in Excel.
MODULE 5: Advanced Dashboards & Reports
Creating a KPI Dashboard with Graphs
Learn how to build and visualize KPIs effectively using dynamic charts and graphs.
Budget vs Actuals Dashboard
Create a comprehensive Budget vs Actuals dashboard with engaging and informative visuals.
Benefits of Taking This Program
By completing this course, you’ll gain:
- Mastery of Excel tools and features essential for financial reporting and analysis.
- The ability to create dynamic dashboards that provide actionable insights.
- Proven techniques for organizing, analyzing, and presenting financial data effectively.
- Increased confidence in using Excel to create reports that can influence business decisions.
- Access to expert guidance and valuable resources for building impactful reports.
Unlock Your Financial Reporting Potential Today
Whether you’re just starting your career in financial analysis or looking to refine your Excel skills, *CFO Excel Dashboard & Reporting* provides you with the knowledge and tools to excel. With a focus on real-world applications, you’ll learn how to build the kinds of financial dashboards and reports that professionals use in top-tier companies.
Related Courses
Related products


Instant Access
Massive Library
100% secure checkout
Support 24/7
Sign up to receive our latest updates
Get in touch
Call us directly?
Address